
As a kid, I was always fascinated by travel. I’m an only child from a relatively middle-class household, so I spent an excessive amount of time daydreaming about how the world worked — specifically, how the world worked in places that I’d never been to before.
Aside from my dirt bike, the first tool that really fueled my escapist pursuits was the Rand McNally road atlas. This was a world that existed before the internet so that paperback annual of state maps was like having a copy of Google Maps that I could carry around. It was a prized possession.
Each year, the atlas was updated, and my father or grandfather, both truck drivers, would purchase the new edition and the old version would be handed down to me. This was great, but I didn’t know what to do with my old version. It was at this point that I discovered why the atlas was updated every year.
They were building new roads!
Seems like mundane discovery now, but as a kid from a backwater town, I assumed everything had been built that was going to be made. Then I noticed that there was a special marker pointing out that Interstate 40 across the state of Arizona was complete. This meant people could travel faster and make fewer stops than they had before.
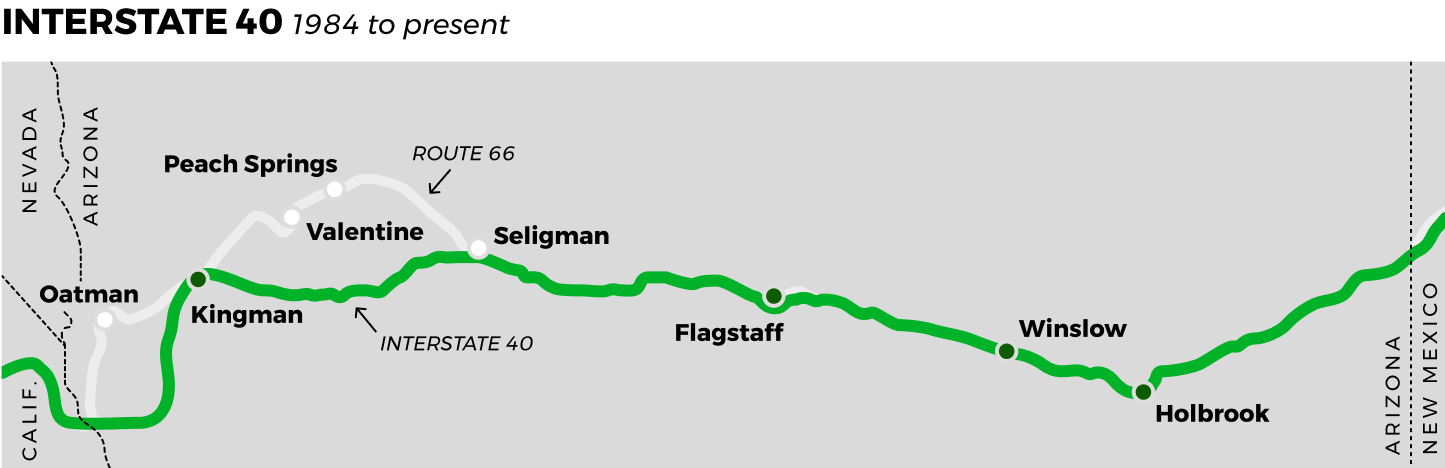
What was unclear to my tiny 10-year-old brain was that this new freeway would alter the fate of the towns that catered to travelers along the soon-to-be-abandoned Route 66.
In the age before cars, there was no interstate highway system in the United States. As the automobile became more integrated into daily life, the Federal Highway Act was passed in 1921 to build a network of roads to allow people to travel freely by car.
One of these cross-country routes would be the famed Route 66, running from Chicago to Santa Monica, California. The road would provide an integral link in the story of America for decades to come. Whether it was farmers fleeing “The Dust Bowl” in the 1930s or midwesterners heading to sunnier climates in the southwestern states in the 1960s, Route 66 was the path people used to migrate.
 Source: newpragmatic.com
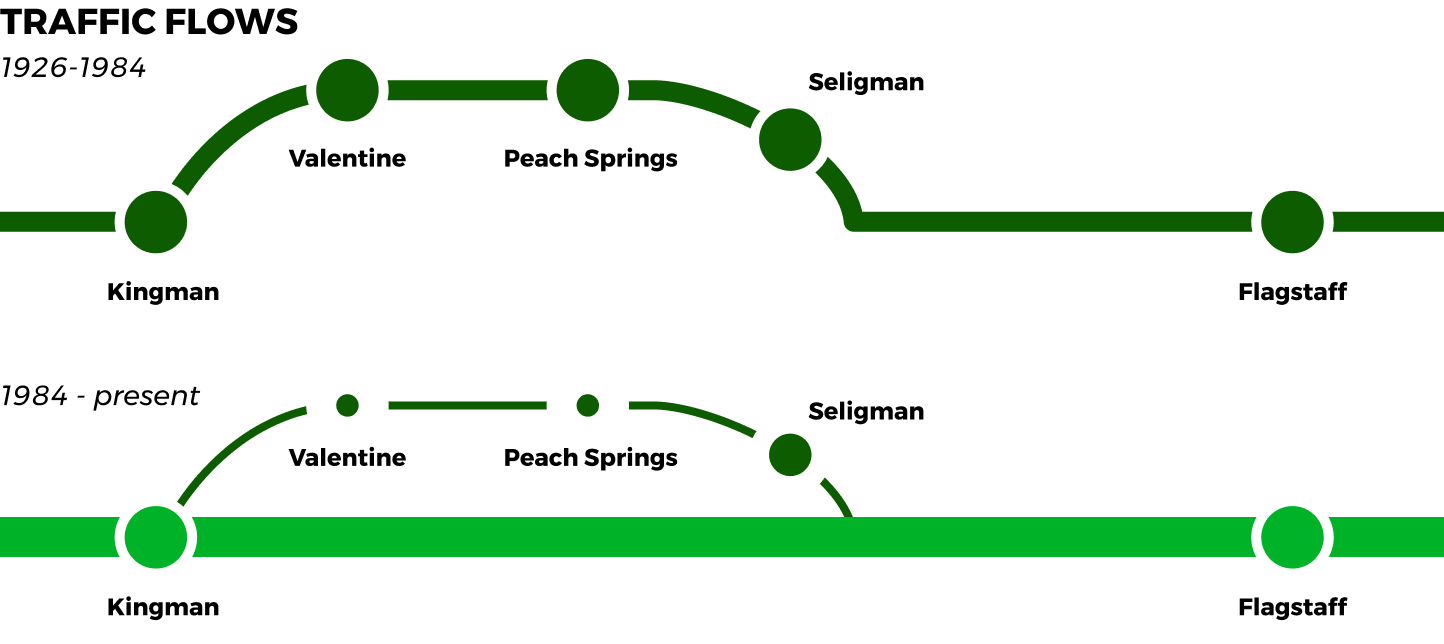
Along that path, numerous towns were built to accommodate travelers. Whether those travelers were moving permanently or just visiting, this system (illustrated above) provided a place to rest and secure the supplies needed to continue the journey westward.
For nearly half-a-century, this cycle continued uninterrupted — and then it stopped.
 Source: newpragmatic.com
The introduction of the faster, more efficient freeways and more reliable automobiles meant people needed to stop less. In the case of many towns along Route 66 in western Arizona, people didn’t stop at all because the interstate bypassed those towns entirely.
No dollars from travelers turned the once-thriving desert outposts into modern ghost towns.
For a dramatized cartoon version of this story, look no further than the Pixar movie, “Cars.” A great deal of the film is primarily set in Radiator Springs, a former Route 66 outpost that has fallen on hard times because Interstate 40 opened nearby and diverted the traffic away. “Cars” is literally a two-hour cartoon about how humans augment systems.
As Pixar accurately illustrated in “Cars,” when we solve problems, we change the world around us. To design responsibly, we must anticipate how those changes will impact our users and society as a whole. Only then can we accurately determine whether the price of change is justifiable or too high.
In the case of the freeway, it’s clear that interstate commerce triumphed over any consideration of the small towns left behind.
Systems all around
The towns that provided comfort and supplies for weary travelers along Route 66 represent small pools of travelers. Most travelers eventually move on, so the influx of people into the town is roughly equal to the number of people leaving, as illustrated below.
 Source: newpragmatic.com
Scientist Donella H. Meadows recognized this and wrote “Thinking In Systems: A Primer” to help us realize both how systems work and how we impact those systems. Driven by a desire to push society toward sustainability and conservation, Meadows created an essential toolkit for breaking complex systems into forms that are easier to understand.
“Once we see the relationship between structure and behavior, we can begin to understand how systems work, what makes them produce poor results, and how to shift them into better behaviors,” Meadows wrote.
A system can exist anywhere and only requires elements to interact in a manner that over time, produces a predictable behavior. Systems can be created by humans, but often we are more responsible for augmenting existing systems than creating new ones.
Water flowing off of a mountainside naturally will form a stream or river without any aid from humans. However, when we build dams, we augment the flow of the waterway and impact the existing system.
 Source: newpragmatic.com
Most people don’t think about a body of water in its entirety because we’re taught at an early age to breaking things down into smaller elements. This approach helps us focus on the parts of the world we can directly impact and reduces problems down to a manageable size. If you’ve ever uttered the phrase “I can’t worry about that. I’ve got enough of my own problems,” then you’re familiar with this approach.
Unfortunately, this is how we make initial decisions that feel right for our goal, but they end up being poor decisions when weighed on their overall impact on the systems we interact with.
The good news is that more humans are pretty good at zooming in and dealing with systems in bite-size chunks — which is precisely the skill you’ll need to have to begin diagramming the component parts of a system!
Atomic parts of a greater whole
Three basic components can be used to diagram almost any system you’ll encounter:
| Component | Function |
|---|---|
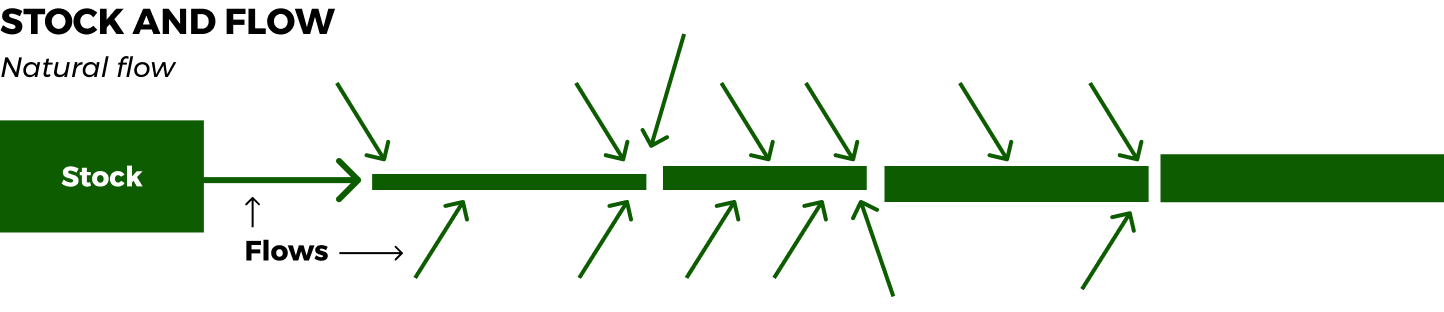
| Stocks | A tangible element of a system that can be measured |
| Flows | Method for adding or removing a measurable element from a stock |
| Feedback Loops | The rate of change that occurs to stock over time |
To illustrate how these elements work together, let’s apply these components to the river concept we just discussed.
I’ve chose the Arkansas River for source material to inform my diagram so that we have some factual elements to derive the components from. The river begins with a single stock of snowpack on two mountain ranges in Colorado. Water melting from the snow forms the initial flow for the river, creating a stream that moves away from the stock. The small stream is joined by flows from other smaller sources and our stream grows into a river over time.
 Source: newpragmatic.com
I purposely left out any loops in our initial diagram, because I wanted first to discuss the types of feedback loops that impact how systems function.
Runaway loops grow or deplete the stock of a system in a manner that reinforces whatever direction the stock is moving. In the event of a heat wave, the snowpack would melt at a faster rate and push more water than usual downstream. Uncorrected, the snow could be depleted, thus depriving the stream of the runoff needed to maintain its existence. Equally important are sudden changes that can happen further downstream. Flooding from intense storms is always a threat. Because a large river has hundreds of smaller streams flowing into it, storms that occur hundreds of miles away can eventually impact people who live and work near the river downstream.
 Source: newpragmatic.com
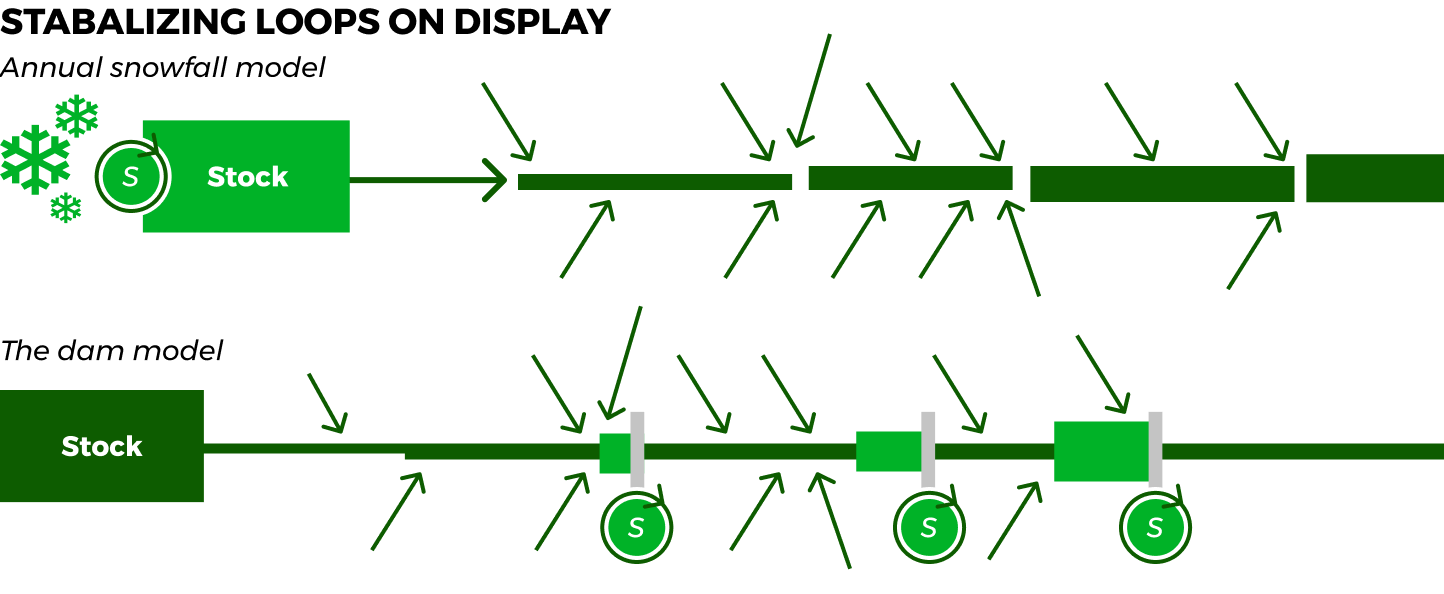
Stabilizing loops maintain the stock of a system at consistent, predictable levels. In our river example, snowfall maintains the snowpack from year-to-year, and relatively stable temperatures melt off only a portion of that snowpack to produce enough runoff to create a river flow. Another reliable method for stabilizing waterways is the construction of dams. A dam restricts the flow of water to help control the threat of flooding while creating localized stocks (reservoirs) which provide much-needed water for areas that previously were uninhabitable. Dams determine the amount of water that flows downstream, releasing more or less as conditions dictate.
 Source: newpragmatic.com
Loops are measured over time and are not to be taken for granted as a system constant. To think of a system as unchanging overtime is to fall into the trap of assumption. In our river example, the snowpack that melts too rapidly or has too little snow for a few seasons can eventually drain a river at its source. This is an example of how a stabilizing loop can become a runaway loop and a key component regarding how systems change over time.
All systems evolve and change, but they continue to exist in spite of these changes because they are inherently resilient. This resilience is both a blessing and a curse. We grow comfortable with a system that operates within a perceived normal range. After a while, we shift our attention to other matters only to later be surprised when that system changes.
Meadows notes several ways that systems can surprise us, but it is the various types of delays that naturally exist in systems that allow change to surprise us. Some delays are hinged directly to actions can take immediately, but the change itself will trail behind. Take the concept of draining one of the reservoirs from the river example. You could open up the dam to drain at full capacity, but it wouldn’t actually drain the reservoir for quite a while. That’s the resiliency of the system, making itself felt in a genuine way.
Jay Forrester was considered by many to be the father of Systems Thinking, and much of his writing focused on the presence of different types of delays that existed in systems. Meadows worked as a research fellow at MIT working with Forrester when she wrote Leverage Points: Places to Intervene in a System.
“Delays that are too short cause overreaction ... Overlong delays in a system with a threshold, a danger point, a range past which irreversible damage can occur, cause overshoot and collapse,” Meadows observed.
Both Forrester and Meadows agreed that delays were the dangerous variable in systems that much be handled with great care. This is why the monitoring of systems over time is essential to avoid reacting too soon — or too late.
Discovering unseen systems
As we’ve illustrated, it is relatively easy to spot systems that operate in large scale, but finding the systems you’re work will impact and rely upon could be harder because they undoubtedly will be smaller systems than a continental watershed or interstate highway system.
A simple example that has become more prevalent in recent years involves large event applications for festivals and conferences. On the surface, this looks like a great idea. Replace the printed program with an app that can deliver all the information related to the event like tickets, schedule, and maps.
You work with your team and do the research necessary to identify all the information that your user will need and the day of the event comes and — your project fails because you were unable to predict a connectivity issue.
Including an offline mode to store information locally is an easy solution, but you needed to communicate to your users that they should download the application BEFORE they arrived.
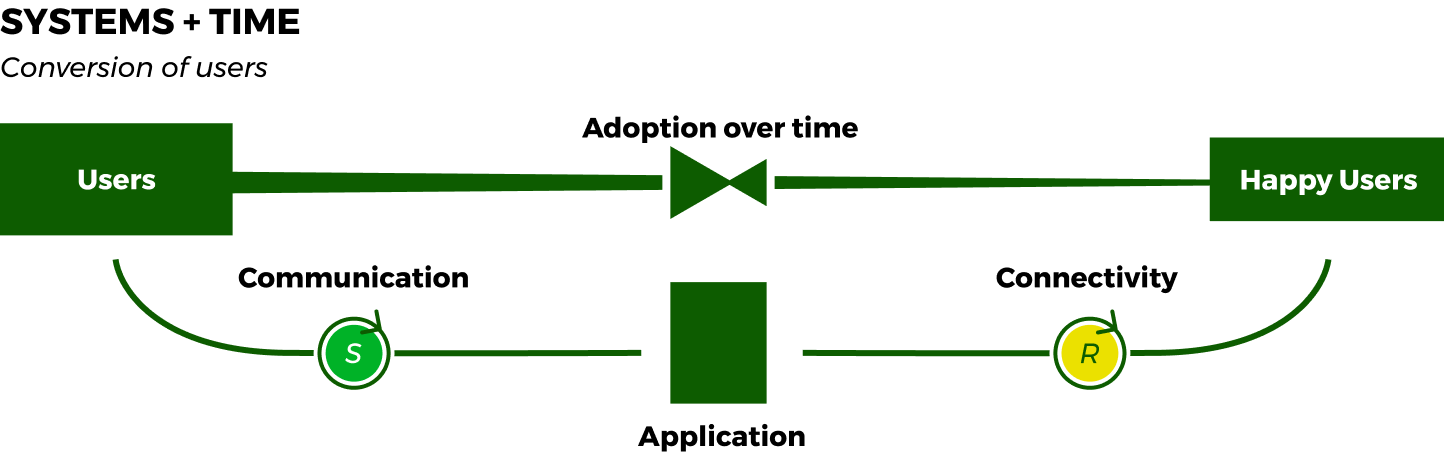
Ultimately, this is an exercise in managing user happiness over time. This is an activity that every user experience designer will encounter, and it is what a typical customer journey will look like.
 Source: newpragmatic.com
Our challenge in a customer journey is to see if we can deliver service while maintaining or growing user satisfaction over time, and as illustrated above, the right solution isn’t necessarily a technical one.
Cultivating your skills to identify and understand system interactions elevates your ability to design because it directly improves your ability to plan. This zoomed-out approach will become a strategic advantage for you over your peers who favor only zooming-in as they solve problems and push pixels in vacuums.
As stated before, systems exist in all sizes, within one another and with various types of delays. As small as the event example is compared to an interstate, there are still many, smaller systems that your work will impact including those that affect the thoughts and actions of individual users. It is here where I ask you to be the most diligent and sensitive.
In general, the goal behind the things we design is to make life better for the people who use them while also returning a benefit to our businesses. A lack of systems thinking could actually hurt our users, our businesses, and society as a whole. To zoom out and think of the broader implications of our work is to move from a position of being human-centered to one that author Erika Hall refers to as being value-centered. The industry is just beginning its journey toward this more substantial, wholistic goal so now is an excellent time for you to jump in as you have a chance to design with this new approach rather than trying to retool your portfolio and your mind for the future ahead.
Design has grown far beyond its roots as the prettifier of the world, and your efforts will likely alter decisions people make and when they make them. The weight you suddenly feel is from your newly discovered responsibility for your users and the systems you’ll impact. Treat them both respectfully, and you’ll have a great career in design.
Illustrating a system
Because the parts of a system can be broken down into smaller and smaller detail, illustrating how a system works is relatively straightforward. Each system shown above has a noted beginning and end. There are feedback loops that indicate how often a system runs.
These elements could all be broken down further if needed. Instead of using the snowpack or streams to build the river, you could start smaller with the flakes of snow or the drops of rain that form those sources.
In the video below, Tom Wujec illustrates how drawing the process of making toast can unlock your ability to diagram systems.
One of the most exciting aspects of Wujec's talk is how tools and group dynamic change the diagramming process. In the exercise below, I would encourage you to use the same sketch-to-sticky note dynamic to see how your work evolves.
https://fs.blog/2019/09/externalities-why-we-can-never-do-one-thing/
Further reading
| Article | Source/Author |
|---|---|
| Why we can never do one thing | Farnam Street |
Exercise
In this chapter, you zoomed out to discover large scale systems at work and then zoomed in to study their component parts. You also examined how systems interact with one another. In gaining the ability to analyze systems, you have the opportunity to understand better how your work impacts those systems.
The exercise detailed below is drawn from a real-life business plan works in some situations but not in others. This is a common issue associated with most start-up businesses. Rather than trying to create a solution, your primary task is to identify the systems that the business interacts with.
The cashless store
A retailer has opened a cashless convenience store in your town. They currently have two locations. Customers enter the convenience store, create or link an account, and are instructed to download an application to their phone. Customers use the app to scan items and simply walk out of the store when they are finished shopping.
Please answer the following questions:
- What systems impact this experience?
- What are the requirements to shop at this store?
- What are the advantages and disadvantages associated with this store?
With the answers above identified, diagram the systems mentioned showing how they impact one another. Your diagram could be a simple sketch or sticky notes (following the Wujec example) or you could use a drawing program like Figma. Simply include a link to your work in your Google Doc.
Once complete, update your Program Journal with links to any assets produced in this exercise. Post your Journal in the #Feedback-Loop channel for review.
Up next Design Ethics